In some cities, it’ll be like moving two states south.
The National Climate Assessment, a stunning report released in November by 13 federal agencies and the White House late last month, showed that climate change has already had devastating impacts on our health and economy, and that costs could mount to hundreds of billions of dollars by the end of the century.
The report maps out what we can expect if we aggressively cut greenhouse gas emissions now, and what would happen if we do nothing. As part of our Weather 2050 project, we used the latter scenario to look at what could happen to temperature and precipitation in US cities by the middle of the century.
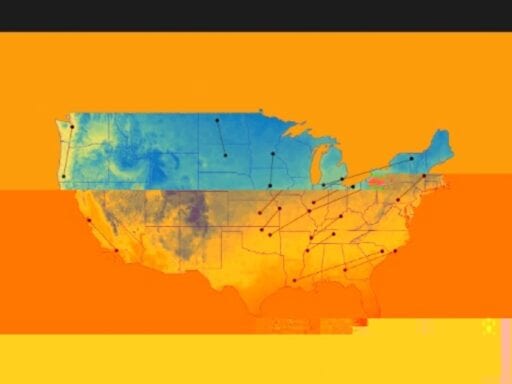
We found that by 2050, many US cities may resemble hotter, more southern parts of the country today. We’ve mapped a few of the most striking transitions here:
As you can see in this map, climate change means cities could move further south in terms of their temperature and rainfall patterns. In some cases, the closest match may be hundreds of miles away. If you want to get a sense of what climate change could mean for your city, you might need to take a road trip.
By 2050, in Cleveland, Ohio, the average summer high is going to heat up by 5.4°F. The average winter low will rise by 5.3°F. That means Cleveland will have the climate of a St. Louis suburb more than 500 miles away.
Let’s zoom in on how climate in different regions could shift. Take a look at this animation of changes in the northeastern US:
/cdn.vox-cdn.com/uploads/chorus_asset/file/13590607/NE_SHIFT_2.gif)
You can see that Scranton, Pennsylvania, will have a climate that resembles that of Round Hill, Virginia, today. That’s a distance of about 220 miles as the crow flies, but it means that Scranton will face average summer peaks that are 4.8°F higher and winter temperature low that are 5.5°F higher.
We can also see this in the southeastern US:
/cdn.vox-cdn.com/uploads/chorus_asset/file/13590795/SE_shift_3.gif)
Cities in the South are moving even further south. By 2050, annual temperature and precipitation patterns in Atlanta, Georgia, will look more like Selmont, Alabama, today. That’s a move of more than 200 miles, with the average summer high jumping 4.1°F to 92.6°F.
Other parts of the country may see smaller shifts by 2050, as you can see in this map of the Southwest:
/cdn.vox-cdn.com/uploads/chorus_asset/file/13590759/SW_SHIFT_2.gif)
Apache Junction, Arizona, will likely experience a year-round climate that’s more like Peoria, Arizona, a city that’s just 50 miles west. But that still means the average summer high from today, 103.5°F, will rise by 4.9°F by 2050.
As you might imagine, the shifts will be even greater by 2080. And in February (two months after this story was first published), two scientists unveiled in Nature Communications a new climate-analog mapping project for the US showing that by 2080, the “climate of most urban areas will shift considerably and become either more akin to contemporary climates hundreds of kilometers away and mainly to the south or will have no modern equivalent.” Play with their fascinating interactive here.
What climate change means for the United States
For any given city, a few more degrees of heat and a few additional or fewer inches of rain over a season may not seem like much. But it can be the difference between having enough rain for healthy crops and a drought that kills them. It’s the difference between wet winter and a white winter.
Not every part of the country is changing at the same rate. Broadly, the more northern parts of the US are warming faster than the southern ones, so the climate shifts tend to be larger. Cities in the eastern US and upper Midwest will likely see larger changes than those in the West.
But it’s clear that hundreds of cities will have to adapt to changes that could be quite profound for people’s way of life. More homes will need air conditioners as summers become filled with deadly heat waves. More vegetation will dry out, creating more fuel for wildfires. This in turn could affect the local economy as climate-dependent industries like agriculture or outdoor tourism decline.
It’s important to note the averages we cite don’t tell the whole story. Some of the more temperate parts of the US like the California coast will see sharper swings in their weather. Rather than spreading rainfall throughout the year, California is expected to see periods of intense rainfall followed by extreme dryness, a phenomenon researchers have described as weather whiplash.
The planet as a whole has already warmed by 1°C since the dawn of the Industrial Revolution, and we are currently on track to see upward of 2°C of warming by 2040. But we still have an opportunity to prevent the worst-case scenarios. And we already know what to focus on. Here are 10 ways to accelerate progress against climate change and a simple guide to the climate policies that work.
How we made these maps
We generated our city pairs by matching the future annual temperature and rainfall projections to year-round climate patterns today, looking for present and future cities that most closely aligned.
To build our comparisons, we averaged daily minimum and maximum temperatures and rainfall patterns for each month over 30 years (1986 to 2015) to establish a climate baseline for cities. Then we looked at how these cities would warm by 2050, again averaging over 30 years (2036 to 2065).
These projections are based on a suite of climate models aggregated in the Localized Constructed Analogs data set developed by the Scripps Institution of Oceanography at the University of California San Diego.
The scenario here is built on a standard set of assumptions in climate models known as RCP 8.5. This is generally seen as a high-end estimate of warming since it presumes the world will continue on the same course of carbon dioxide emissions with limited improvements in technology or efficiency.
That said, it tracks closely with where we are now and serves as a useful upper boundary for what we can expect. RCP 8.5 also doesn’t result in a vast difference in climate change estimates compared to other scenarios when looking at the middle of the century. The largest variations under RCP 8.5 emerge around 2100.
There are several important caveats to our analysis. Part of the reason we’re not seeing such big geographic changes in analogous cities in the south is that we don’t have enough cities even further south available for comparison. Our dataset only includes the continental US, but a Texas city could see its climate look more like a city in Mexico, and a Florida city may resemble an island in the Caribbean. So there were many Southern cities for which we don’t have matches at all. We chose the best available matches with the data we do have.
We’re also only comparing cities based on temperature and precipitation, looking at which cities today most closely resemble a given city’s projected changes by 2050. These are just two variables out of dozens that define a local climate. In addition, temperature projections out to the middle of the century tend to be more robust than precipitation models, which are much more dependent on local variables and present more uncertainty.
However, the biggest uncertainty here is the same as it is for all climate predictions: How quickly will we act on climate change? Whether the world shifts to cleaner energy, eats less meat, manages land better, pulls carbon dioxide out of the air, or sticks to business as usual will mean vastly degrees of future warming.
What we do from here on out genuinely matters for our hometowns, our country, and future generations around the world.
Author: Umair Irfan
Read More