Unemployment rates, hiring, working from home — the pandemic is changing everything about the state of work.
The novel coronavirus has led to unprecedented employment situation in America — one that’s only beginning to show up in the data.
In an effort to combat the spread of Covid 19, cities and states around the country have called for many non-essential businesses to shutter or at least adjust their operations. The efforts have wreaked havoc on numerous industries, including food service, travel, and retail, among others.
Hugely populous states including New York, California, and Illinois enacted “stay at home” measures last month that required many nonessential businesses to close and residents to limit their public interactions. But Florida, home to 21 million residents and the third-most populated state in the country, did not enact its own stay at home orders until April 3, an action might have come too late to prevent a large outbreak. A number of other states, including Texas and South Carolina, have yet to close many businesses or mandate that people stay home. Numerous models suggest these actions are the key to lessening the stress on hospitals and flattening the curve. (Here’s a look at cases, tests, and deaths by state.)
Since many cities and states didn’t enact work stoppages and stay at home orders until near the end of last month — and other localities have yet to do so — the full effects of coronavirus on jobs won’t likely show in the data until the coming weeks and months.
What’s certain is those effects will be far-reaching and will change the way we work as we know it. Automation is likely to spike in this economic downturn, resulting in more robots and fewer jobs. Many jobs that had been done in offices are now being performed from living rooms around the country, as the work from home trend becomes a forced reality. And the gig economy has become more important — and dangerous — than ever, as more Americans rely on delivery people for their everyday needs.
Here are six charts that begin to show the disruption to the labor economy.
1) The unemployment rate jumped to 4.4 percent
The unemployment rate jumped to 4.4 percent in March and total nonfarm payroll employment fell by 701,000, according to Bureau of Labor Statistics jobs report data released Friday. For context, the February unemployment level was 3.5 percent, a longtime record low. The Federal Reserve Bank of St. Louis had predicted last month that the unemployment rate could reach 32 percent — higher than levels seen during the Great Depression. Note that the jobs report data are based on the pay period that includes the 12th day of the month, meaning that the pictures in this and the following chart are rosier than reality. A number of cities and states didn’t enact work stoppages and shelter in place directives until later in March, so those job losses will show up in later data.
2) Unemployment claims doubled the record, just a week after it was set
Last week, the Department of Labor reported a record 3.3 million initial unemployment insurance claims in mid-March. That number shortly doubled, with initial jobless claims in the US hit 6.6 million for the week ending on March 28. For context, that unemployment insurance claims figure was 280,000 in the week ending March 14. As my Vox colleague Matthew Yglesias wrote, this number is “unprecedented” and “there’s little reason to believe that next week’s report will be any better,” noting that large states including Georgia and Florida are planning to adopt widespread shutdown policies that New York and the West Coast enacted last month.
/cdn.vox-cdn.com/uploads/chorus_asset/file/19866745/unemployment_chart_2_UPDATE.jpg) Christina Animashaun/Vox
Christina Animashaun/Vox
3) Even those still employed are seeing reduced hours
What doesn’t show up in the unemployment rate numbers is the extent to which cutbacks and reduced staffing have resulted in those still employed working fewer hours. According to Friday’s Bureau of Labor Statistics jobs report, the average workweek for private sector workers declined slightly to 34.2 hours in March from 34.4 hours in February. Like the unemployment rate, these numbers are from the middle of March so don’t show the full extent of reduced hours. During the last recession, that number bottomed out at 33.7 hours per week.
4) Job listings are down substantially compared to previous years
Job listings on Indeed, the largest US job hiring site by traffic, are another early indicator of the future job situation, and can precede more drastic measures like layoffs. On Indeed’s website, the number of US job listings have declined 20 percent compared to this time last year. As Mark Muro, a senior fellow at Brookings Institution’s Metropolitan Policy Program, said of listings declines last month, which then were down around 7 percent, “Posting a job is a forward-looking glimpse of managers’ sense of a business’s prospects. This is a vote of no confidence.”
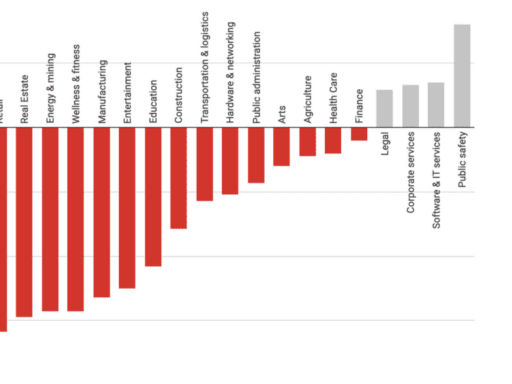
5) Job hiring is down — but not in every industry
As you might expect, hiring has taken a dive as well. LinkedIn estimates that hiring in the US was down 1.1 percent in March compared to a year ago and down 1.3 percent compared to February. LinkedIn calculates a hiring rate based on people who added a new employer and job to their profile as a share of total LinkedIn members. Declines for individual industries were much higher. Compared to February, there were hiring declines in every segment LinkedIn measured, with the biggest drops — more than 20 percent — in the recreation and travel as well as wellness and fitness industries. When looking at a year-over-year comparison, the picture is somewhat brighter, with increases in hiring for a handful of industries: corporate services, legal, public safety, and software and IT services.
6) For many office workers, working from home became the new working
The trend of working from home has been growing incrementally for years. With mandatory work stoppages and orders to cease public gathering, that trend became reality for many office workers around the country. For nonessential businesses that rely on computers to complete their jobs, having employees work from home became the only way to continue conducting business. To get a sense of how coronavirus accentuated the trend, we looked at public company transcripts mentioning work from home. In April, there were 423 transcripts mentioning the topic — more than there were in the last decade combined — nearly all in conjunction with mentions of coronavirus.
All of these data points are only early snapshots of the pandemic’s effect on the state of work in the US. The unemployment rate will likely jump much higher next month, when more state stay at home orders begin showing up in the data. In coming weeks, the US will also see more fully how these efforts drive unemployment claims and which states have suffered the worst. Hiring and job posting data from sources like Indeed and LinkedIn will continue to provide insight into what all this means for different industries. Meanwhile, gig economy workers, like those at Amazon and Instacart, will continue to fight for higher wages and safer conditions, as they try and work amid an increasingly dangerous situation.
It will take months and even years to understand the full effects that coronavirus and its responses have on how we work.
Author: Rani Molla
Read More