You know how the regular polls were wrong? Exit polls are much worse.
Before the votes from the 2020 presidential election have been fully tabulated, pundits all across the land are venturing forth to offer analysis based on the demographic breakdowns provided in the exit polls.
If we’re looking to reiterate our own prior convictions, the data is serviceable. But if we want actual information about voting behavior, exit polls are not very useful — and the early exit polls that haven’t even been weighted to the final vote count are even worse.
To start with, as we all keep learning over and over again, it is difficult to conduct accurate surveys of voters’ opinion. Nothing about conducting an accurate exit poll is any easier than conducting an accurate pre-election poll. If anything, it’s harder. Some people vote on Election Day, and other people vote early through different means, so especially this year, with a huge shift in how people vote, the modern “exit” polls need to combine multiple waves of survey data.
Last but by no means least, one advantage exit pollsters do have is that they know the final outcome of the election. So you never publish an exit poll saying Biden won the election by 8 points when he really won by 4. Instead, the exits are weighted to match the actual outcome.
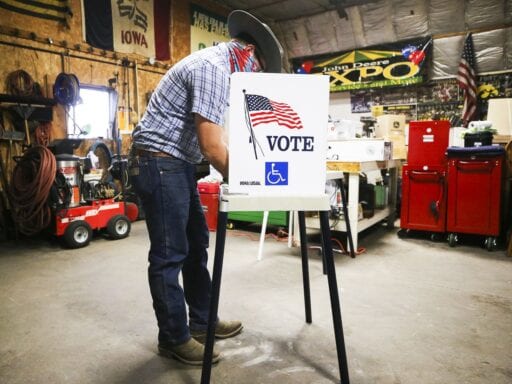
/cdn.vox-cdn.com/uploads/chorus_asset/file/22019603/GettyImages_1229446903.jpg) B.A. Van Sise/NurPhoto via Getty Images
B.A. Van Sise/NurPhoto via Getty ImagesBut we don’t yet know what the actual outcome is, so the “results” of the exit polls keep changing as more votes are counted. CNN’s exit poll write-up has a disclaimer that reads “exit poll data for 2020 will continue to update and will automatically reflect in the charts below,” meaning that not only is the data you’re working with inaccurate the very page you are citing will say something different in the future.
Unfortunately, factoids derived from exit polls — like “53 percent of white women voted for Trump” — tend to become hardened conventional wisdom pretty quickly. More accurate information only becomes available later (a Pew analysis based on administrative data about who actually voted suggests the share was around 47 percent), at which point the truth comes out, but nobody cares anymore. It’s tempting to seize on this kind of information to illustrate broader points we want to make about social or cultural trends, but realistically it’s just not possible to answer certain questions with the level of precision implied by exit poll results.
Trump’s mysterious overperformance with white college graduates
Exit polls, public opinion surveys, and county-level demographic data all clearly show that Black and Hispanic voters overwhelmingly backed Biden (despite some Trump gains with these communities) while whites with no college degree love Trump and college-educated whites are more skeptical.
But according to the exit polls, Trump actually did much better with white college grads than pre-election polls suggested. That’s spurred some strong takes, including Andrew Sullivan’s suggestion that white college graduates lied to pollsters en masse and a data-rich article by political scientist Erik Kaufman arguing that college-educated professionals became Shy Trumpers because of concerns about political correctness in the workplace.
Why did college-educated white voters lie to the pollsters about their Trump support? https://t.co/FZnjyqNSvW
— Andrew Sullivan (@sullydish) November 6, 2020
It’s certainly possible that something like this is true. But the more boring (and also more likely) explanation is that the exit polls are overstating Trump’s support among white college graduates.
According to the exit polls, for example, non-college whites were 34 percent of the electorate in 2020. That’s exactly the same as the 34 percent share that exit pollsters found in 2016. But when Pew went back and examined the electorate based on validated voter data, they found that non-college whites were 44 percent of the 2016 electorate. Catalist, a Democratic data firm that works with voter file data found that non-college whites were 48 percent of the 2016 electorate.
One possibility is that the non-college white share of the electorate plummeted for mysterious reasons. A second, more plausible theory is that the exit polls are undercounting non-college voters again. So what happens when you undercount non-college voters in a poll? In a conventional poll, you’ll just end up underestimating Trump’s support. But in an exit poll, you know how many votes Trump got. So with too few working-class whites in your sample and too many white professionals, to make the numbers add up you need to exaggerate Trump’s level of support with both subgroups.
In reality, Trump is less popular with working-class whites than the exit polls say and also less popular with white college graduates. It’s just that the white population is more working-class than the exit polls say.
The 53 percent myth
Back in 2016, the myth of majority support for Trump among white women was based on a similar error.
As Molly Ball wrote in a little-read 2018 debunking, Pew’s analysis suggests that the exit polls were simply undercounting the number of white voters. By doing that, the polls ended up exaggerating the share of the white vote that Trump won. In this particular case the difference between 53 percent and 47 percent is not large, but it happens to cross the psychologically significant 50 percent threshold. (Keep in mind that all polls are subject to error, and Pew’s methodology likely gets closer to the correct share but is also not exact.)
The truth took a long time to come out, however, because it simply takes a long time for comprehensive voter file or census data to be available.
If you want to be more reliable with your hot takes, look at maps and census information about county-level demographics. Trump, for example, did worse overall in 2020 but better in Miami and in the Rio Grande Valley in Texas and in the handful of Massachusetts towns with large Hispanic populations and in the precincts of Milwaukee with large Hispanic populations. It is theoretically possible that this is all some kind of weird coincidence, but it really looks like some broad gains for Trump with Hispanic voters. To know how broad exactly, we need to wait for full tallies from Arizona, Nevada, and the notoriously slow counters in California.
You can also just see with your eyes that Trump collapsed in the suburbs of Atlanta, in Fort Worth, and in many other jurisdictions that are full of economically comfortable college graduates. Catalist says it will have more information in a month or two and we can check back then.
It’s possible there was some kind of secret anti-anti-Trump backlash lurking somewhere out there among college grads, but it’s hard to see exactly where it would be.
Author: Matthew Yglesias
Read More