Environmental justice data needs a reboot.
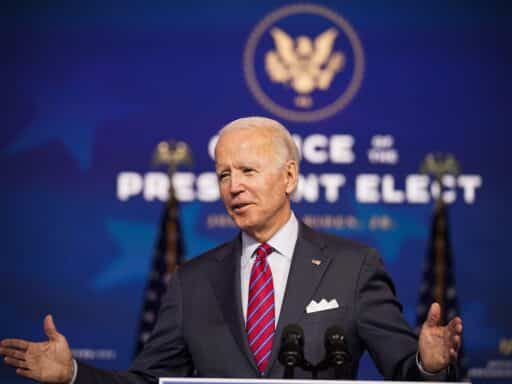
President-elect Joe Biden campaigned on the most ambitious environmental justice plan ever offered by the nominee of a major political party. His Build Back Better agenda included a commitment to invest 40 percent of his $2 trillion clean energy plan into communities living on the front lines of poverty and pollution.
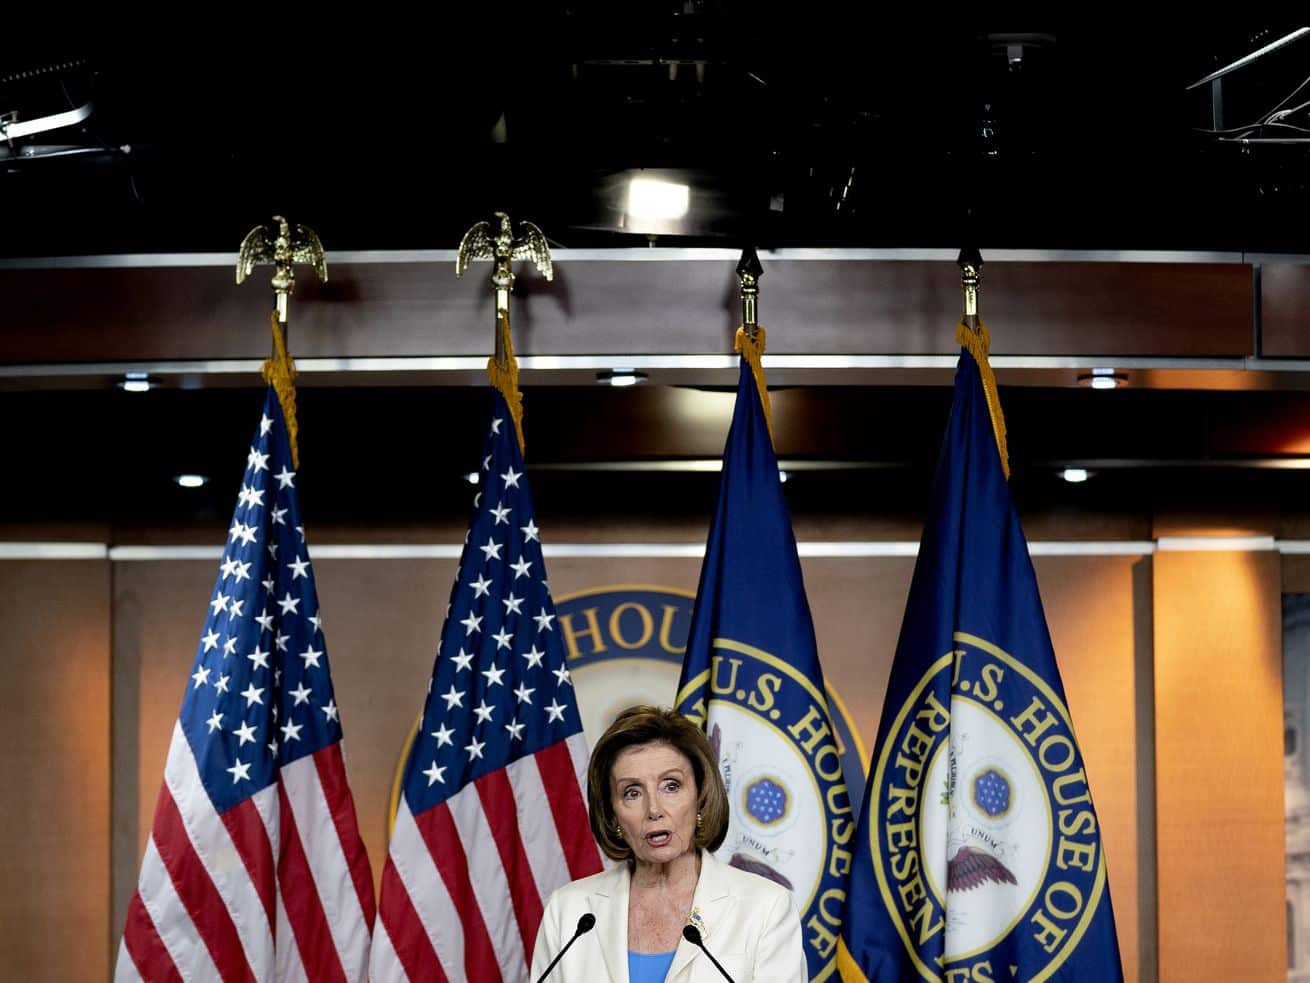
At the same time, his running mate, Sen. Kamala Harris of California, co-authored the Climate Equity Act with Rep. Alexandria Ocasio-Cortez (D-NY), outlining ways the next administration can operationalize environmental justice across the agencies. After a summer of historic protests that saw some 15 million to 26 million people take to the streets to take a stand against racial injustice in policing, it’s almost certain that the incoming Biden administration will take bold action to address the intersecting crises of environmental pollution and racial inequality.
But this mandate for anti-racist policy raises a question: How, in the first place, will a Biden administration identify the most polluted and impoverished communities across the country?
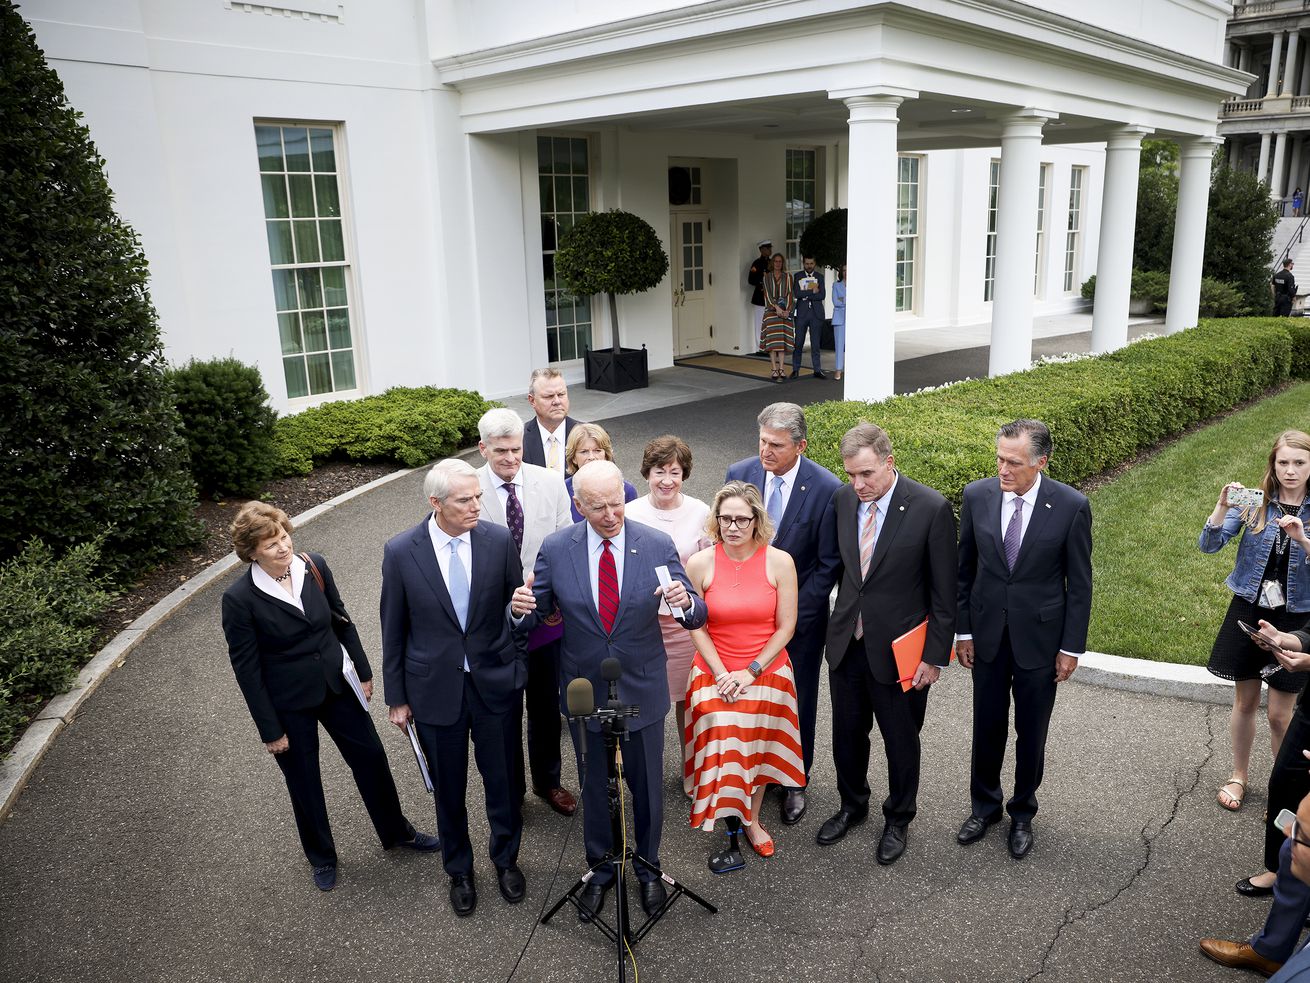
And if Democrats were to gain control of the Senate in the Georgia runoffs, thus being in a position to pass Biden’s $2 trillion climate and infrastructure plans that commit 40 percent of public spending to front-line communities — an investment that would total $800 billion — how would federal agencies charged with carrying out those policies prioritize communities for spending?
To target and support the communities most burdened by environmental injustice, the Biden administration will need to revamp and iterate on existing equity mapping and screening initiatives while learning from effective models in the states. While they might seem esoteric, data and maps are likely an essential starting point for policymakers interested in fighting environmental degradation and racial inequality.
“Data drives policy, and the lack of data drives policy”
Environmental justice — the idea that environmental benefits and burdens are distributed unequally throughout society, often along racial, gender, and class lines — deeply shapes communities across the United States. The environmental justice movement primarily emerged out of the struggle for civil rights and the research of Bob Bullard, PhD, whose pioneering work showed how pollution maps onto racial divisions at the neighborhood level.
After decades on the periphery of the mainstream — and white — environmental movement, environmental justice began attracting national attention in the 1980s and 1990s. In 1994, President Bill Clinton signed the first executive order to “Address Environmental Justice in Minority Populations and Low-Income Populations.”
One of the main consequences of this executive order was to create screening tools that compile indicators of pollution and inequity like EJView and EJGat that, under the Obama administration, evolved into the Environmental Protection Agency’s EJSCREEN, a mapping tool that compiles data from across the US to identify communities with higher environmental vulnerabilities and burdens. A tool like EJSCREEN can help policymakers allocate resources and target regulations to the communities that need them most.
But EJSCREEN has been mostly neglected by the Trump administration, which proposed a 71 percent cut to the EPA’s environmental justice program in its 2021 budget. And the tool could use some work.
State data in EJSCREEN is inconsistent, making it difficult at times to get comparable snapshots of communities in different regions, according to Mustafa Santiago Ali, a former senior adviser for environmental justice at the EPA. EJSCREEN could also integrate more data sets, particularly on public health, Ali said.
He acknowledged that this would be especially consequential during the pandemic. (A recent Harvard University study found that people who live in areas with higher air pollution are more likely to die from the coronavirus.) Ali emphasized that impacted communities should have a strong say in which data specifically is and is not included.
EJSCREEN is also hard to use, which means it’s difficult for policymakers, journalists, and advocates to access the information they need. “It doesn’t do what it’s meant to do. If you’re thinking about pollution burdens, you need to see the whole picture, and EJSCREEN doesn’t let you do that easily,” said Mijin Cha, assistant professor of urban and environmental policy at Occidental College. “The problem is not that the data isn’t there — the bigger issue is that it is unusable.”
Here is a screenshot of the mapping tool’s view of the Navajo Nation, which stretches across parts of Arizona, New Mexico, Utah, and Colorado — the area in red, more or less:
/cdn.vox-cdn.com/uploads/chorus_asset/file/22150774/Screen_Shot_2020_12_07_at_11.30.20_AM.png) EJSCREEN
EJSCREENBut EJSCREEN does not allow users to map multiple data sets at a time. Here is the same map of the Navajo Nation, this time with the low-income data set mapped. (Note that users cannot map income and racial data simultaneously.)
/cdn.vox-cdn.com/uploads/chorus_asset/file/22150775/Screen_Shot_2020_12_07_at_11.32.01_AM.png) EJSCREEN
EJSCREENFinally, here is the same area mapped by proximity to superfund sites. (Note, again, that it’s not possible to map this dataset alongside demographic data like race and income.)
/cdn.vox-cdn.com/uploads/chorus_asset/file/22150784/Screen_Shot_2020_12_07_at_11.34.06_AM.png) EJSCREEN
EJSCREENEJSCREEN was launched after the Obama administration passed the American Recovery and Reinvestment Act of 2009. Ali, who worked in the administration at the time, said that an effective equity mapping tool like it would have been immensely helpful, and could have helped policymakers screen investments to ensure they were targeting the areas of greatest need. “Imagine if they had a tool that would have given them snapshots of the country in talking about investments that could be happening,” he said. “Data drives policy, and the lack of data drives policy.”
California shows how better environmental justice data can shape policy
To begin addressing this challenge, policymakers can look to the states for guidance. Washington, Maryland, and New York have all developed, or are developing, data collection, mapping, and scoring tools to address environmental injustice.
The most sophisticated of these state-level models can be found in California, where a mapping and screening tool called CalEnviroScreen helps the state identify communities for prioritized climate investments. The Biden administration would be wise to overhaul EJSCREEN or to create a cross-agency equity mapping initiative based on the California model.
CalEnviroScreen, like the Clinton executive order that first created federal screening tools, is a product of the environmental justice movement’s success. The tool was created in the wake of the state’s fight over cap and trade, which environmental justice groups opposed on the grounds that a cap-and-trade model allows big corporate polluters to pay a small fee and simply continue damaging low-income communities of color.
After passing a cap-and-trade bill, Democrats in the state bargained with the environmental justice movement. Now 35 percent of revenues from cap-and-trade are reinvested in the state’s poorest and most polluted neighborhoods. To identify those neighborhoods, the state created CalEnviroScreen. The current iteration of CalEnviroScreen, the third generation of the tool, collects data on 20 indicators and uses them to identify disadvantaged communities for targeted investments.
Here’s a screenshot of the tool focused on Oakland, California, the hometown of one of the authors (Julian).
/cdn.vox-cdn.com/uploads/chorus_asset/file/22150796/Screen_Shot_2020_12_07_at_11.35.40_AM.png) CalEnviroScreen 3.0
CalEnviroScreen 3.0Note that the tool develops a cumulative impact score based on pollution burdens and population characteristics. In this map, the historically Black and redlined neighborhoods of East Oakland appear in red, indicating a higher score and greater incidence of environmental injustice.
“California has been able to map EJ communities,” said Mari Rose Taruc, former co-chair of the California Environmental Justice Advisory Committee. “Let’s see the nation catch up to us by fixing the data gap.”
All this data collection, mapping, and scoring comes with significant political, social, and economic implications for policymakers and communities. In California, for example, lawmakers have had to consider which data sets to consult and how to weight environmental versus public health indicators. In the context of a pandemic, such decisions come with significant downstream consequences for public policy. They also create geographic and community competition between parts of the state that want to be identified and prioritized by the tool.
Should, for example, lawmakers in Sacramento prioritize the more agricultural Central Valley — home to many migrant farmworkers — for investment and other policy interventions ahead of deindustrialized urban centers like Long Beach and Oakland? And how do the state’s tribal communities, whose lands fall under tribal and federal rather than state jurisdiction, fit in? What about more qualitative data? If we took the California model national, how would we account for the weight of history?
Take Louisiana’s Cancer Alley, where petrochemical plants have been built atop lands that were once plantations and graveyards of enslaved people. If the quantitative data doesn’t foreground communities like that, should qualitative data be consulted as well? And is the EPA even the right agency to house such a tool? If we acknowledge that these crises are intersectional — and not strictly racial, environmental, or economic in nature — why not create a cross-agency data collection, mapping, and screening initiative?
Nationally, a robust plan to take on environmental injustice through targeted investments rooted in data could similarly create competing regional coalitions of disadvantaged communities with their representatives on Capitol Hill jockeying to ensure that their constituents benefit from programs and investments. It also presents future administrations with pressing questions about how to carry out this essential data collection, mapping, and screening process.
All of these questions, tested in California and now on the brink of going nationwide if President-elect Biden pushes forward with his environmental justice plans, point to a bigger and broader truth about the nature and power of data: Where, how, and what we measure matters.
How better data could empower communities to undo legacies of pollution
When used well, data can empower social movements pushing for justice. The Black Lives Matter movement has led, for the first time, to the creation of national data sets about police killings of civilians and people of color — often housed at media outlets like the Guardian and the Washington Post. Activists, journalists, and policymakers now use this data to tell stories and shape policy leading to shifts in public opinion as well as tangible policy changes in police departments across the country.
In the short term, data collection might lead to small but wide-reaching reforms like programs to mitigate and redress legacies of pollution that have led to inequities like the Flint water crisis and the asthma endemic in the Bronx. More ambitiously, data might also broaden the debate and build the case for reparations for slavery and the return of land to tribal nations. So far, those conversations have primarily focused on economic inequality and, in particular, the wealth gap. They almost certainly also have environmental and public health dimensions we should consider.
“When we have data that’s capturing how many folks are shot [by] police, when we have data that shows investments in certain areas and lack of investments in others, it then paints a picture of how certain things happen in certain communities,” said Ali. “When we talk about ‘We can’t breathe’ we understand it is rooted in both the data — the reality of where many of these things are being located and the data that shows where redlining and restrictive covenants are happening.”
With a commitment from the Biden administration to reboot EJSCREEN or to create a similar cross-agency tool that would, at the end of the day, do something quite simple — collect and synthesize information about social and environmental inequities — researchers, communities, and policymakers might build deeper understandings of these problems and construct more effective policies to address them. Data alone is, of course, insufficient for the justice that we need and deserve. But in the right hands, it can empower movements for change with the moral gravity of the truth — the only ground upon which justice can stand.
Marcela Mulholland is the deputy director for climate at Data for Progress. Julian Brave NoiseCat is the vice president of policy and strategy at Data for Progress.
Author: Marcela Mulholland
Read More